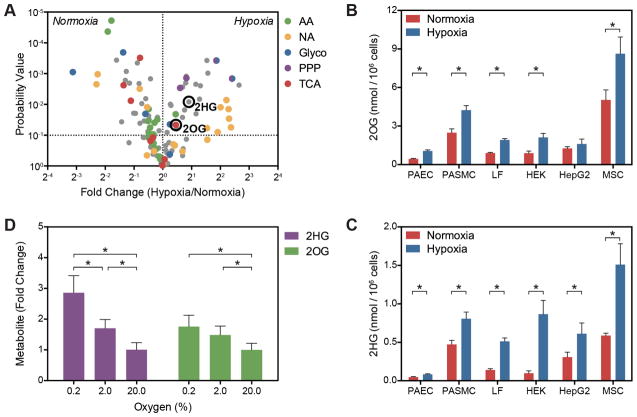
Figure 1. Hypoxia Increases 2OG and 2HG.
(A) Volcano plot of metabolite changes in PASMC treated with 0.2% oxygen for 24 h compared to 21% oxygen controls. AA, amino acids; NA, nucleic acid pathway intermediates; PPP, pentose phosphate pathway intermediates; TCA, tricarboxylic acid cycle intermediates. (B and C) Targeted LCMS reveals that hypoxia-mediated increases in 2OG (B) and 2HG (C) occur in a variety of cell types. PAEC, human pulmonary artery endothelial cells; PASMC, human pulmonary artery smooth muscle cells; LF, human lung fibroblasts; HEK, human embryonic kidney 293 cells; HepG2, human liver hepatocellular carcinoma cells; MSC, human mesenchymal stem cells. (D) Intracellular 2OG and 2HG vary inversely with oxygen tension in PASMC (p < 0.0001 for trend for each). Data are mean ± SEM. See also Figure S1.

