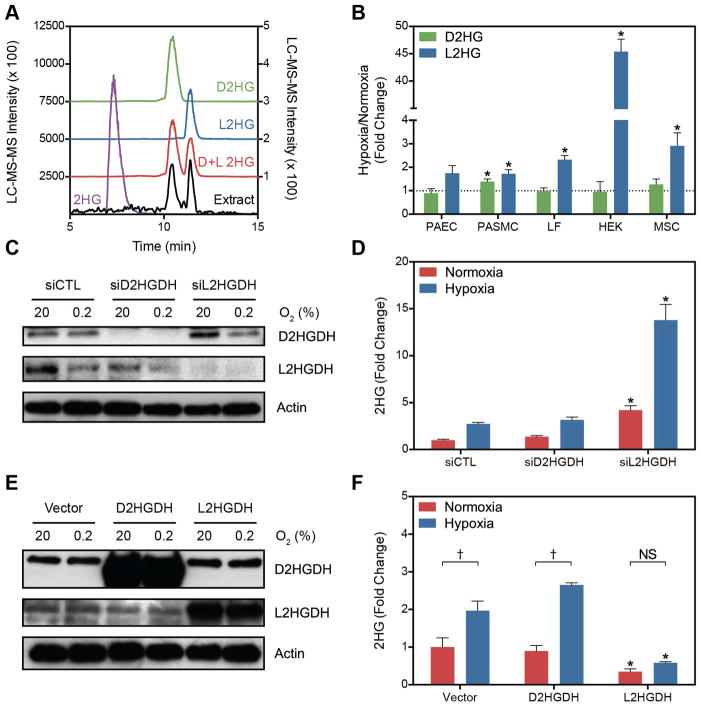
Figure 2. Hypoxia Preferentially Increases the L Entantiomer of 2HG.
(A) Extracted ion chromatograms (XIC) of underivatized 2HG (purple) and derivatized enantiomerically pure standards of D2HG (green), L2HG (blue), or a racemic mixture (red). Chromatograms are offset for clarity. The XIC of a derivatized cell extract is also shown (black) with intensity values on the right y-axis. (B) Fold change after hypoxia treatment of D2HG and L2HG in derivatized cell extracts. (C) Immunoblot of D2HGDH and L2HGDH levels in LF treated with targeting siRNA compared to a non-targeting control siRNA (siCTL). (D) Total 2HG in cell extracts treated with D2HGDH or L2HGDH siRNA. (E) Immunoblot of LF cell extracts overexpressing D2HGDH or L2HGDH. (F) Total 2HG in LF overexpressing D2HGDH or L2HGDH compared to Vector control. Data are mean ± SEM. See also Figure S2.

