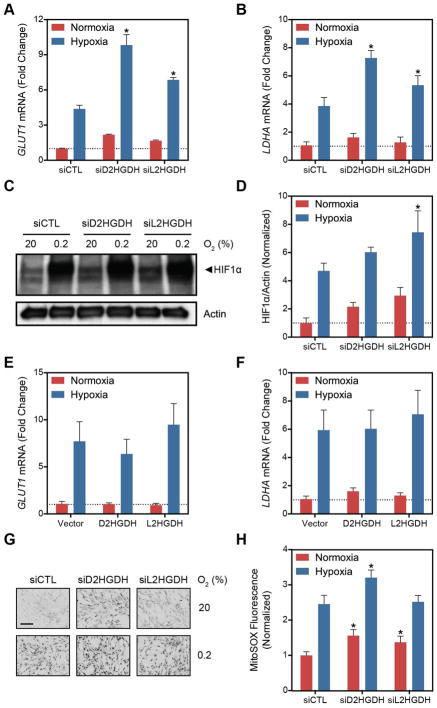
Figure 5. D2HGDH and L2HGDH Knockdown Activate HIF Target Gene Expression.
(A–B, E–F) Expression of HIF target genes, GLUT1 (A and E) and LDHA (B and F) in LF treated with siD2HGDH and siL2HGDH (A and B) or D2HGDH and L2HGDH (E and F). (C) Representative immunoblot demonstrating normoxic HIF1α stabilization by siD2HGDH and siL2HGDH. (D) Quantification of HIF1α densitometry. (G) Representative micrographs of MitoSOX-stained cells. Images were inverted and leveled for presentation. Scale bar is 20 μm. (H) Quantification of MitoSOX staining. Data are mean ± SEM. See also Figure S5.

