
Figure 6. 2HG Metabolism Is Coupled to Cellular Redox State.
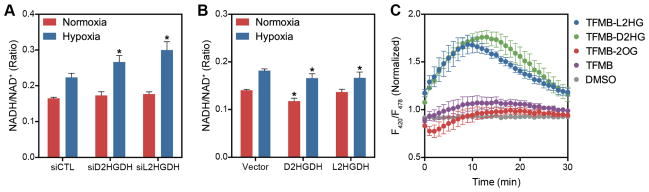
(A and B) NADH/NAD+ ratio determined by enzymatic cycling assay in LF treated with siRNA targeting D2HGDH or L2HGDH expression (A) or overexpressing D2HGDH or L2HGDH (B). (C) F420/F485 fluorescence ratio, corresponding to cytoplasmic NADH/NAD+, in LF treated with permeable analogues of 2OG, D2HG, and L2HG (500 μM) at time 0 normalized to the fluorescence ratio of untreated cells. Data are mean ± SEM. See also Figure S6.