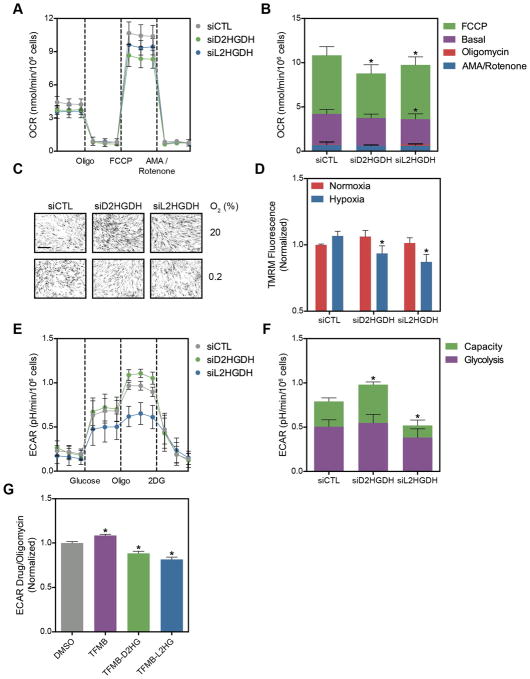
Figure 7. D2HGDH and L2HGDH Silencing Affects Oxidative Phosphorylation and Glycolysis.
(A) Oxygen consumption rate (OCR) of LF treated with siRNA targeting D2HGDH or L2HGDH after treatment with the indicated compounds (Oligo, oligomycin; AMA, antimycin A). (B) Summarized data from (A). (C) Representative micrographs of TMRM-stained LF. Images were inverted and leveled for presentation. Scale bar is 20 μm. Scale bar is 20 μm. (D) Quantification of TMRM staining in normoxia and hypoxia in siRNA-treated LF. (E) Extracellular acidification rate (ECAR) of LF treated with siRNA targeting D2HGDH or L2HGDH before and after treatment with oligomycin to measure glycolytic capacity (2DG, 2-deoxyglucose). (F) Summarized data from (E). (G) Cell-permeable analogues of D2HG and L2HG inhibit oligomycin-stimulated ECAR. Data are mean ± SEM. See also Figure S7.

