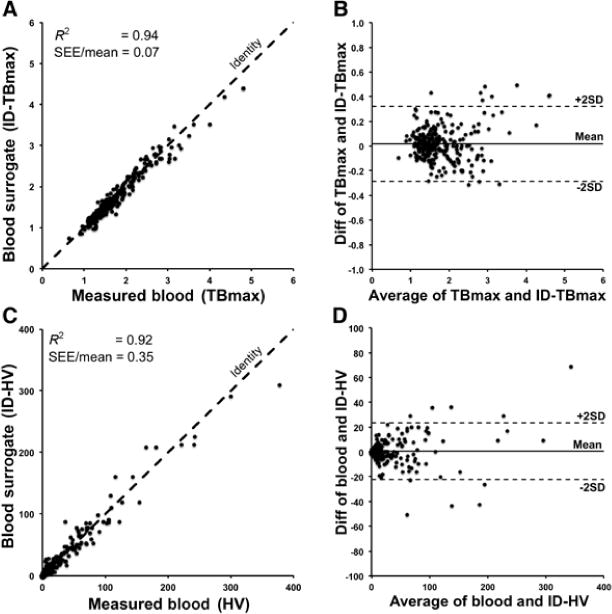
Figure 3. Correlation of Hypoxia Parameters.

(A) Regression plot of TBmax vs ID-TBmax for 269 surrogate blood regions shows a strong relationship with a small COV (SEE/mean). (B) The Bland-Altman plot shows clustering around the mean with little bias. Plots of HV vs ID-HV values in (C) and (D) shows a similar profile.
