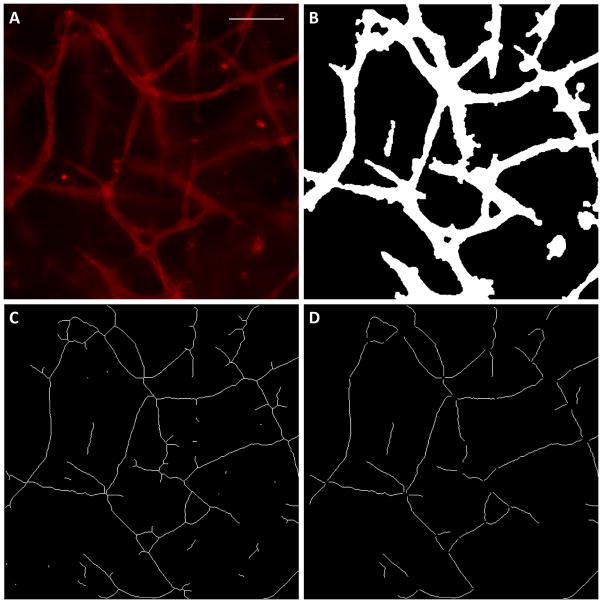
Figure 4.
Quantification of network morphology in whole mount images. (A) The original CD31 image. Scalebar = 100 μm. (B) The binary image produced by thresholding and removal of rounded cells. (C) The binary image after skeletonization. Many small segments are present as artifacts of the skeletonization process. (D) The binary image after bifurcation points and the small artifacts were removed. These segments correspond well to the original image.

