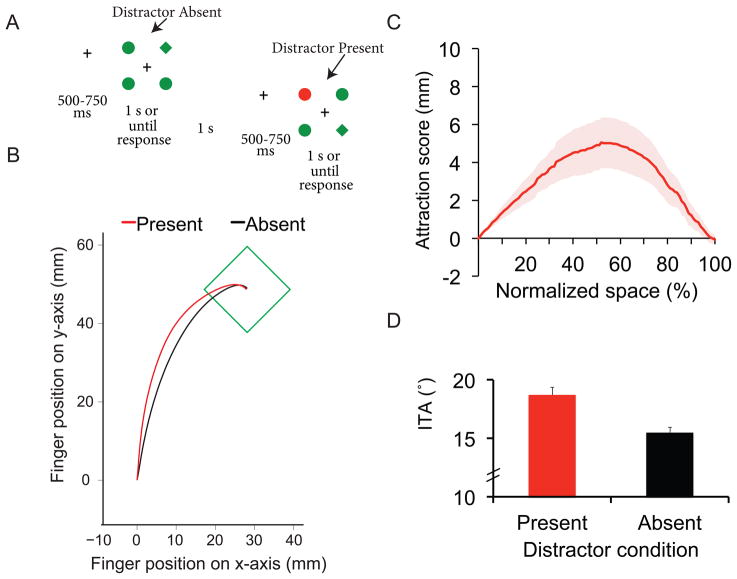
Figure 1.
Stimuli and data from Experiment 1. A) A sample sequence of trials from Experiment 1. Participants were required to point to the unique shape. One of the non-unique shapes was colored red on 50% of all trials. B) Average resampled trajectory across all subjects for a target located in the lower right corner on distractor absent trials (black line), and a target located in the lower right corner with a color distractor in the upper left corner (red line). C) Distractor attraction scores calculated across the entire resampled movement, averaged across all subjects. Positive scores indicate hand position that is pulled towards the location of the color distractor on distractor present trials. D) Initial trajectory angles for distractor present and absent trials. All error bars reflect standard error of the mean (S.E.M.).

