
Figure 4.
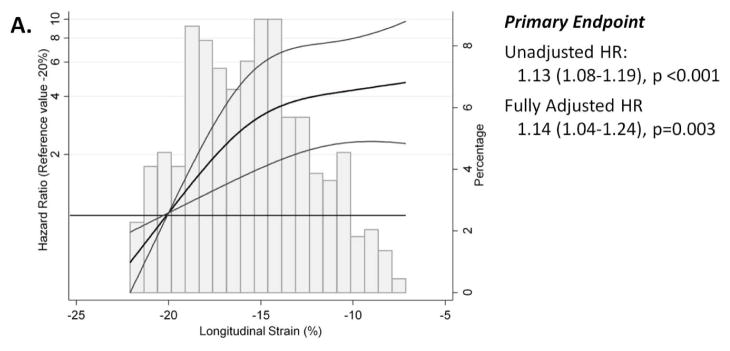

(A) Restricted cubic spline analysis demonstrating the unadjusted hazard ratio (black line) and 95% confidence limits (grey lines) for the primary composite endpoint of HF hospitalization, aborted cardiac arrest, or CV death (n=447; reference value: −20%). (B) Forest plot demonstrating the hazard ratio for the primary outcome, per standard deviation change in echocardiographic risk factors in HFpEF in multivariable adjusted models in the TOPCAT echocardiography study. Caption: For panel A, hazard ratios (HR) are per 1% absolute increase in LS. Histograms demonstrate the distribution of LS in the study population. Fully adjusted analysis (Model 2) is adjusted for age, gender, race, randomization strata (prior HF hospitalization or biomarker criteria), region of enrollment (Americas versus Russia or Georgia), randomized treatment assignment, core lab LVEF, history of atrial fibrillation, heart rate, New York Heart Association class, history of stroke, creatinine, hematocrit, LV mass, LVESVi, and E/E’ ratio. Values presented are a linear approximation. For panel B, risk associated with negative LVEF and e’ are shown. Covariates in multivariable model are the same as in panel (A) with the exception of LV mass, LVESVi, and E/E’ ratio. See text for further details.