
Figure 5.

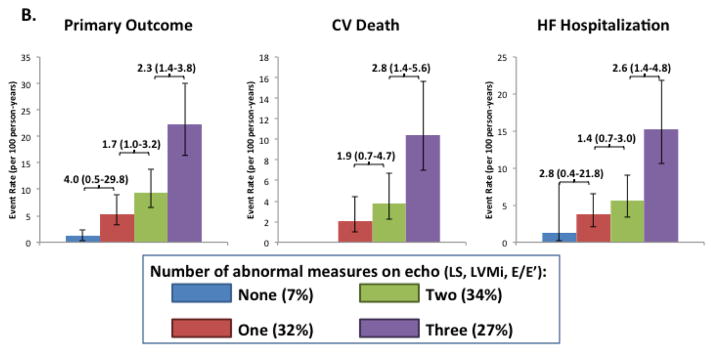
Venn diagram demonstrating the overlap between abnormal LS, LVH, and elevated E/E’ patients among patients will all 3 measures available (n=330). Panel (B) shows the event rates (per 100 person-years) among the 330 participants with all three measures of the primary composite endpoint (CV death, HF hospitalization, aborted cardiac arrest; 87 total events), CV death alone (32 total events), and of HF hospitalization alone (47 total events) based on the number of abnormal echo findings (abnormal LS, LVH, and elevated E/E’).