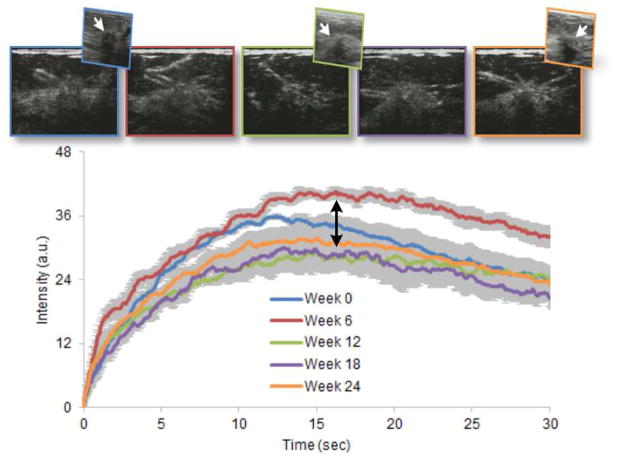
Figure 3.
Representative series of DCE-US images of the same breast cancer at baseline (week 0) and at weeks 6, 12, 18, and 24 after initiation of neoadjuvant chemotherapy (color-coded left to right, respectively) including select grayscale ultrasound (US) subimages (hypoechoic lesion indicated by white arrow). Time-intensity curves (and ROI variability, error bars) from each dataset are shown illustrating the progressive changes in shape that occur as the tumor changed in response to systemic drug treatment. Pathologic analyses revealed that the tumor was an invasive ductal carcinoma.

