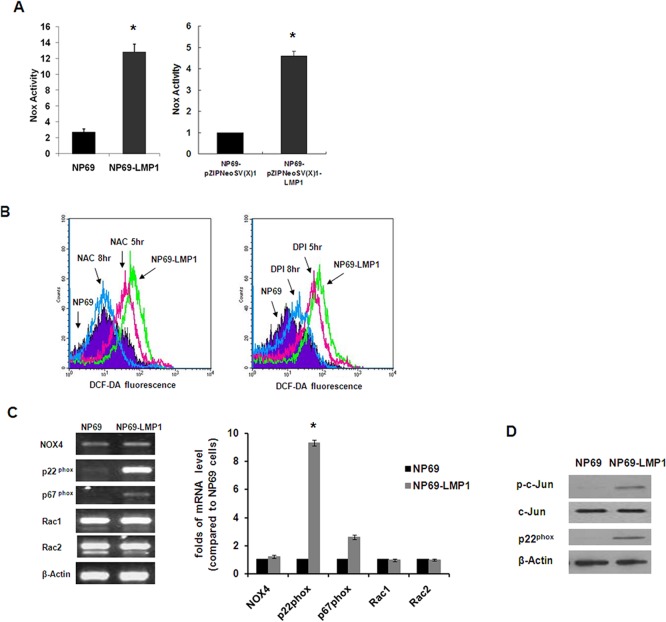
Fig 2. Oncogenic transformation by LMP1 causes increased NOX activity.
A: Comparison of NOX activity in NP69 and NP69-LMP1 cells (left panel), NP69-pZIPNeoSV(X)1 and NP69-pZIPNeoSV(X)1-LMP1 transient-transfected cells (right panel) measured by a luminometer using lucigenin in the presence of NADPH (mean ± SD of three experiments; * p < 0.01). B: In NP69-LMP1 cells, ROS level was suppressed by both 0.5 mM NAC (34% at 5 hr and 83% at 8 hr, left panel) and 5 μM DPI (22% at 5 hr and 78% at 8 hr, right panel). ROS level was measured by flow cytometry using DCF-DA. Each histogram is representative of three experiments. C: Expression profile of NOX family subunits by RT-PCR in NP69 and NP69-LMP1 cells. LMP1 induced a significant increase in p22phox expression. β-Actin served as a loading control. Compared to NP69 cells, p22phox expression was significantly higher in NP69-LMP1 cells (*p<0.001). D: Basal protein expression of c-Jun, phosphorylated-c-Jun and p22phox in NP69 and NP69-LMP1 cells. β-Actin served as a loading control.

