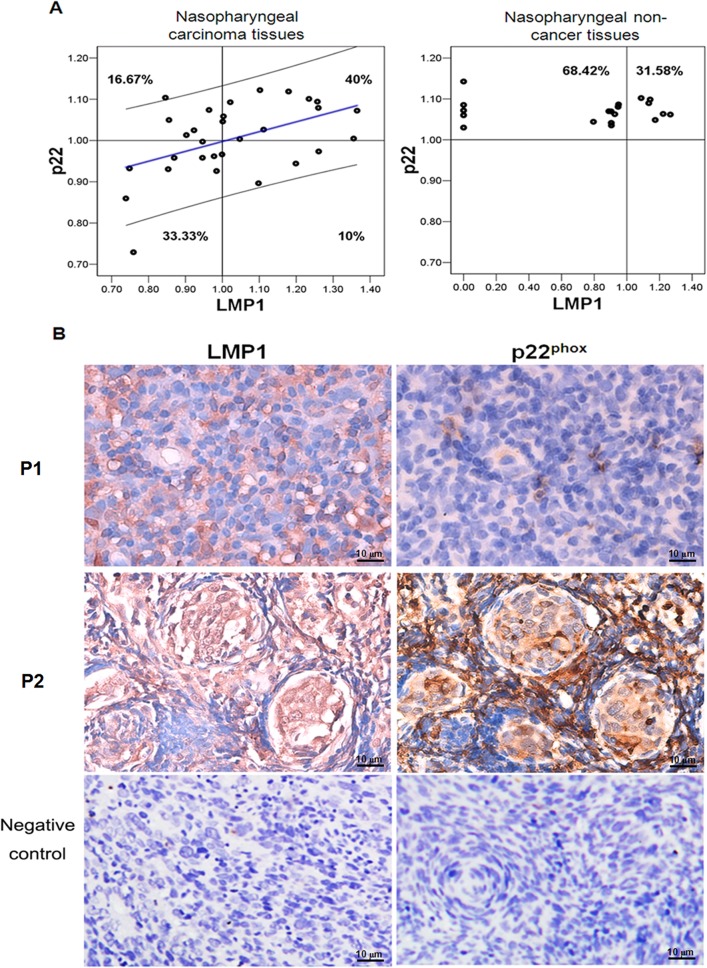
Fig 4. A positive correlation between LMP1 and p22phox expression was detected in nasopharyngeal carcinoma.
A: The distributions of NPC tissue samples and non-NPC tissue samples with LMP1high/ p22phox high, LMP1low/p22phox low, LMP1high/p22phox low and LMP1low/p22phox high were determined with SPSS correlation analysis. B: In a tissue array, the p22phox and LMP1 expression levels were detected in NPC cancer tissues using an IHC assay. P1 and P2 represents two NPC tissues from patients with distinctive p22phox and LMP1 expression pattern. P1 tissue has low p22phox and LMP1 expression level, and P2 has higher LMP1 and p22phox expression level. NPC tissue sample with LMP1 negative and p22phox were served as negative control (magnification × 400).

