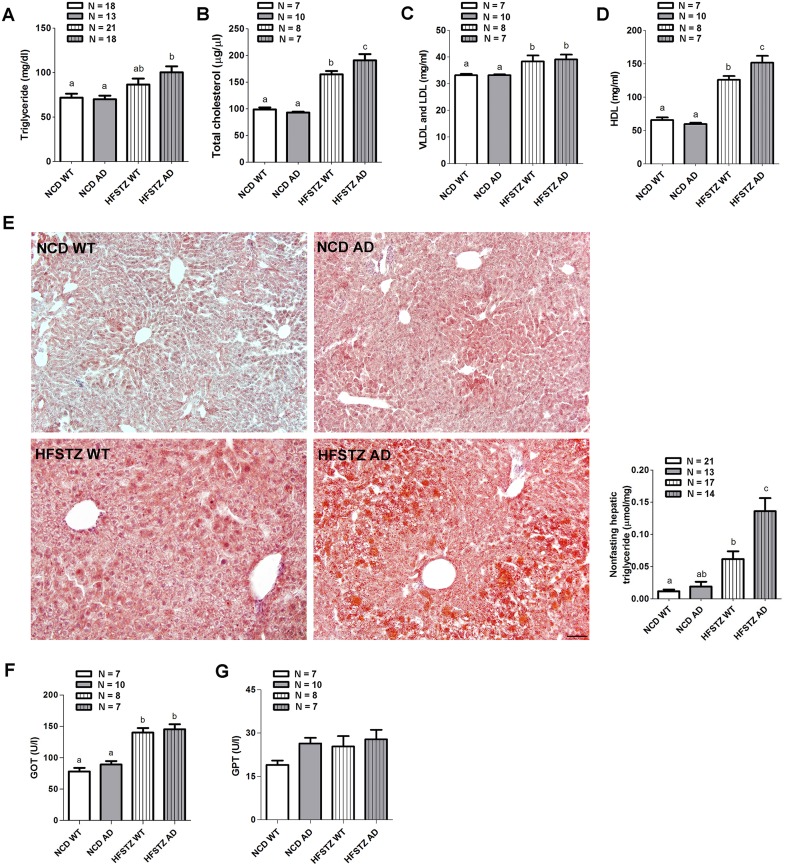
Fig 3. Analysis for serum lipid and hepatic steatosis.
The levels of (A) serum TG, (B) total cholesterol, and cholesterol in (C) VLDL and LDL, as well as (D) HDL measured after 11-week dietary manipulations. (E) Representative histological microphotographs of liver sections stained with Oil Red O (scale bar, 50 μm) and hepatic TG contents of mice were quantified. (F) Serum GOT and (G) Serum GPT were also measured. Bars represent the mean ± SEM. Experimental groups labeled with different letters are significantly different from each other (p < 0.05).

