
Fig. 1.
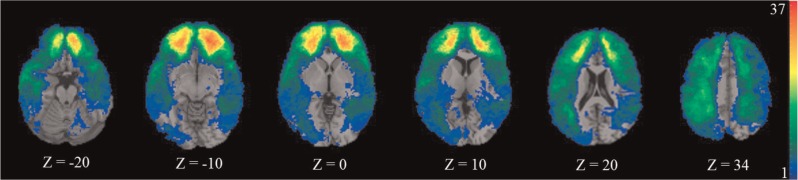
Map shows the overlap density of the lesions in pTBI patients. Color depicts the number of patients with the overlapping lesion at each voxel. Orange indicates more subjects and blue indicates fewer subjects. The right hemisphere is shown on the reader’s left side