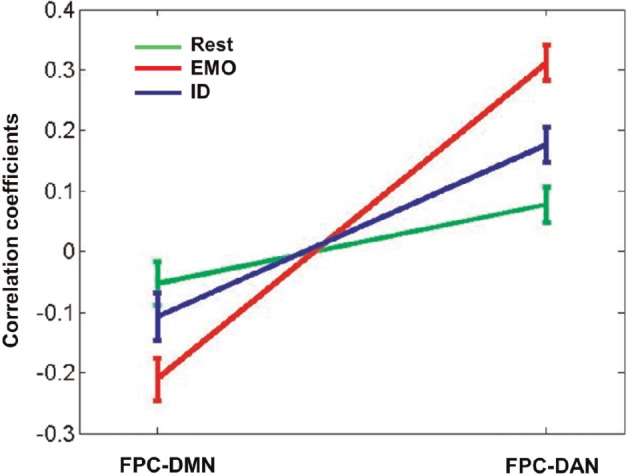
Fig. 6.

Functional network connectivity among three large-scale brain networks altered by social WM task. The line graph shows the correlation coefficients (mean ± standard error) between two pairs of networks (FPC-DMN and FPC-DAN) in three states [Rest (green), EMO (red) and ID (blue)]. Relative to the Rest, the FPC-DMN connectivity became more negative, whereas the FPC-DAN connectivity became more positive during tasks. The EMO task produced more modulation of the FPC-DMN connectivity than the ID task. Significant alterations between conditions were assessed by means of paired-samples t-tests.
