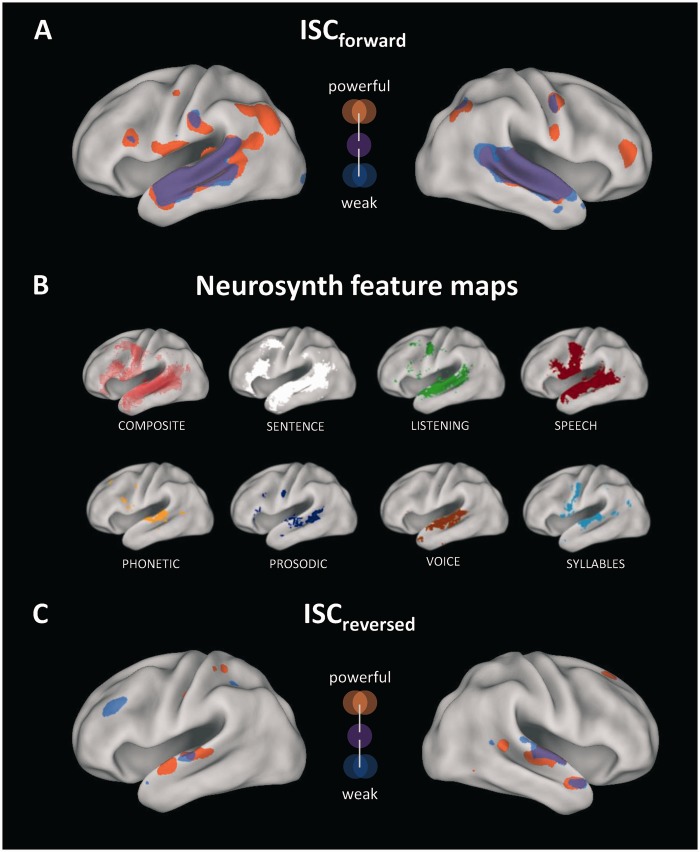
Fig. 5.
(A) Illustration of ISC results for powerful (orange) and weaker (blue) speeches (overlap in purple). (B) Neurosynth reverse inference maps for several linguistic features. For visualization purposes, data were mapped to the PALS-B12 surface atlas (Van Essen, 2005). (C) As in (A), but for the reversed speech control experiment.

