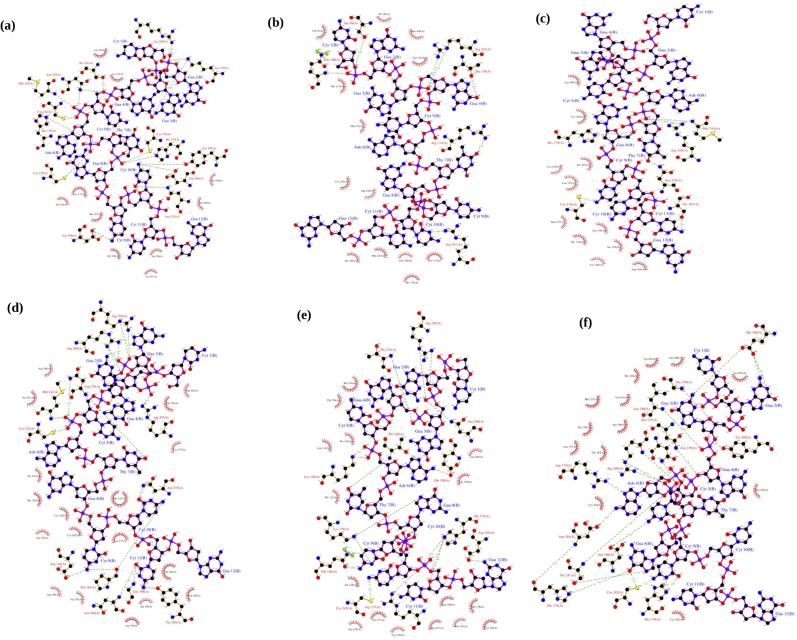
Fig 8. Residue interaction at the protein-DNA interface in the p53-DNA complex.
(a) Native-DNA complex, (b) R273C-DNA complex, (c) R273H-DNA complex, (d) R273C_T284R-DNA complex, (e) R273H_T284R-DNA complex and (f) R273H_S240R-DNA complex. The color coding represents the p53 protein in brown color, DNA in purple color. Hydrogen bonding interactions are denoted by dashed lines. This figure was prepared by Ligplot.

