
Fig. 1.
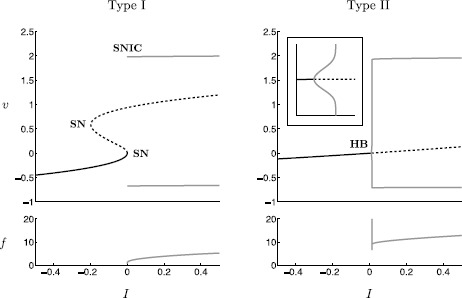
Bifurcation diagrams of the canonical model (1) together with ‘frequency–current’ (f–I) plots: (Type I) ; SNIC bifurcation near where the frequency approaches zero; (Type II) ; supercritical singular Andronov–Hopf bifurcation near ; the subsequent canard explosion is clearly visible; note the small frequency band for the relaxation oscillation branch