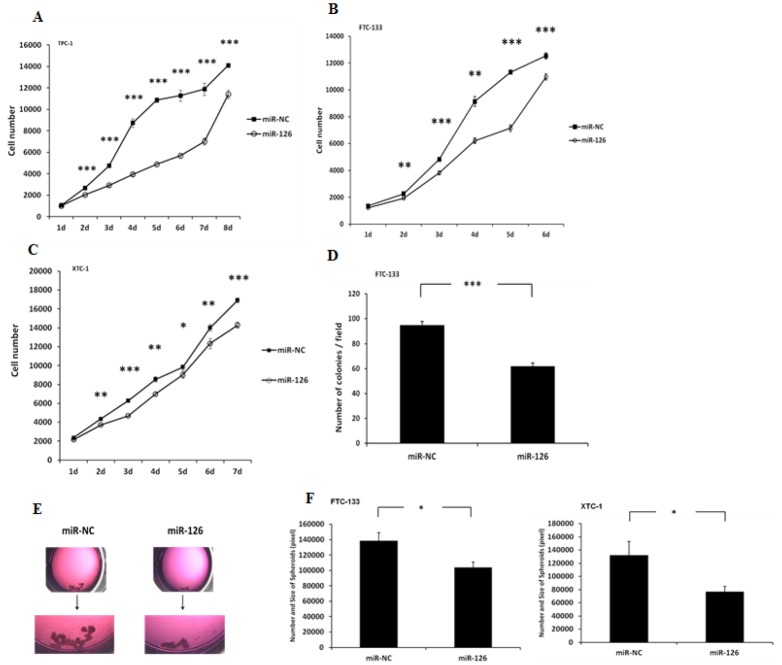
Fig 2. miR-126-3p overexpression inhibits cellular proliferation, and colony and spheroid formation.
(A–C) Thyroid cancer cell line proliferation with miR-126-3p overexpression. The Y axis represents the cell number. Error bars represent the standard error of the mean (SEM). (* indicates p<0.05; ** indicates p<0.01; *** indicates p<0.001). (D) miR-126-3p overexpression inhibits colony formation in thyroid cancer cells. Colony numbers in FTC-133 cell lines. The Y axis represents the number of colonies per field. Error bars represent SEM (*** indicates p<0.001). (E) miR-126-3p overexpression decreases the size and number of spheroids. Top panel: representative image of spheroids in culture with miR-126-3p overexpression (FTC-133 cells). Lower panel: Quantification of spheroid differences between XTC-1 and FTC-133 cells with miR-126-3p overexpression. The total area occupied by the spheroids within an image was measured by circumscribing the perimeter of each spheroid, marking the entire area, and calculating the pixel numbers with ImageJ software (National Institutes of Health, Bethesda, MD, USA). The Y axis represents the size and number of the spheroids. Error bars represent SEM (* indicates p<0.05).

