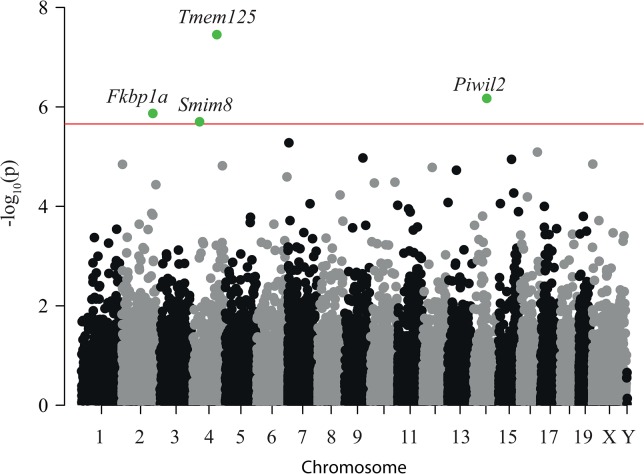
Fig 4. Strain-specific DEHP-induced DMRs.
The Manhattan plot shows the statistical significance in minus log10 on the y axis, and the location of the probes in the genome with alternate gray and black colors in respect to the chromosomes locations on the x-axis. Horizontal red line correspond to the threshold for statistical significance settled as p = 0.05 corrected with the number of tested probes (yielding p<2.2*10−6). The name of the gene is given and the point appears green in case of genome-wide statistical significance. 5 individuals were tested in the four groups (FVB and C57BL/6J background with both control and DEHP300 treatment).

