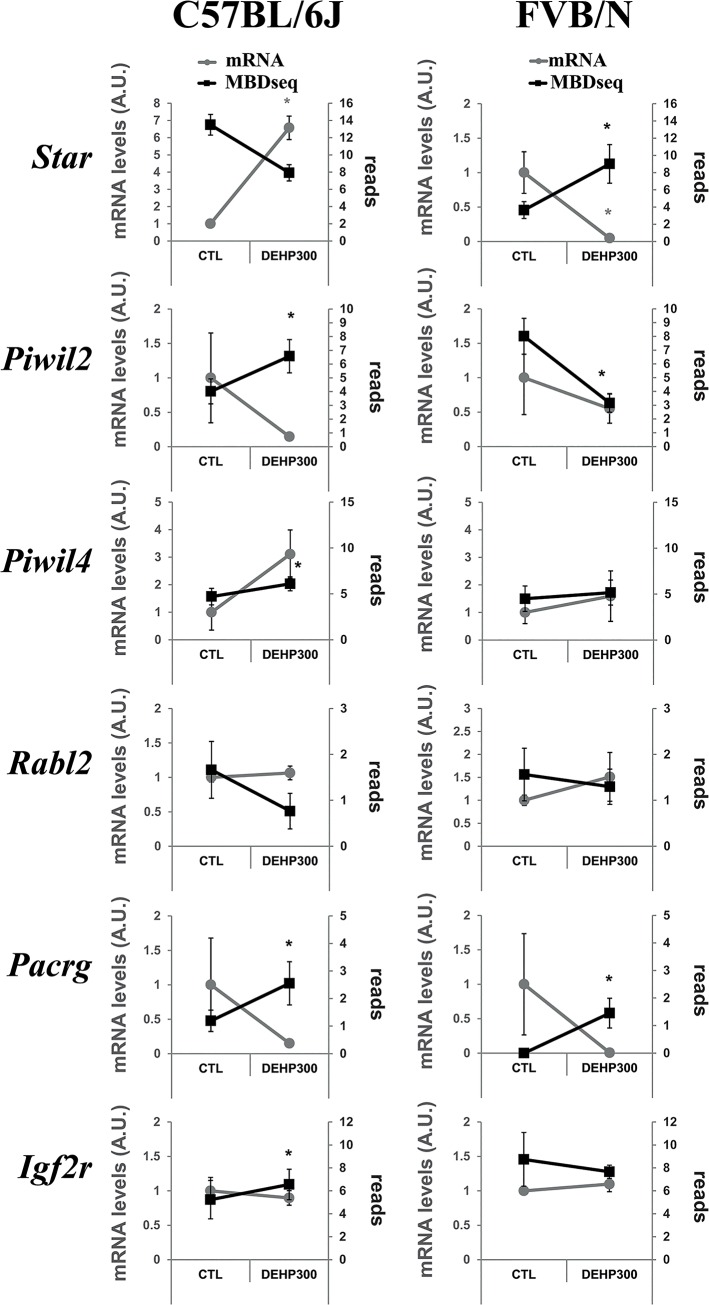
Fig 6. Impact of promoter methylation on gene expressions in pre-selected candidates.
Graphical representation of the obtained MBDseq and RT-qPCR results on a subset of pre-selected genes and in respect with the mouse strain background, C57BL/6J on the left part of the figure and FVB on the right side of the figure. The x-axis showed results obtained between the control condition (CTL) always on the left and the DEHP 300 condition (DEHP) always on the right of each graphic as mentioned. Levels of mRNA appear as gray dots and are expressed as arbitrary units on the left-side Y-axis labelled in gray and named mRNA levels (A.U.). A.U.: Arbitrary units relative to the control condition. The MBD-seq promoter methylation levels appear as black squares and are expressed in average of reads for each condition labelled on the right-side Y-axis in each graphic. Errors bars represent standard error of measurements for mRNA levels and standards deviation for MBD-seq derived reads averages. Inverted slopes between MBDseq and mRNA data are interpreted as results consistent with a negative impact of promoter methylation on gene expression. Stars in gray represent significant differences in term of mRNA levels obtained between controls and DEHP 300 conditions according to two-tails T-test resulting in p-value lower than 0.05. Stars in black represent statistically significant differences in term of average reads numbers obtained between controls and DEHP 300 conditions according to two-tails T-test resulting in p-value lower than 0.05.

