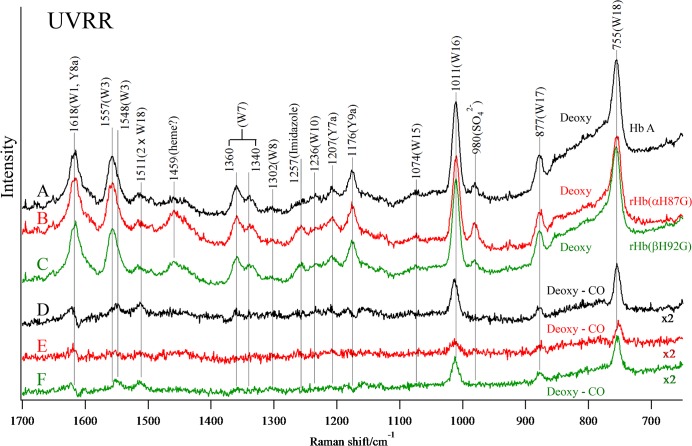
Fig 7. The 229-nm excited UVRR spectra of Hb A, rHb(αH87G) and rHb(βH92G).
Spectra are deoxyHb A (A), deoxy rHb(αH87G) (B) and deoxy rHb(βH92G) (C), and the difference between Hb A (deoxy–CO) (D), rHb(αH87G) (deoxy–CO) (E) and rHb(βH92G) (deoxy–CO) (F). The hemoglobin concentration was 200 μM (in heme) in a 0.05 M phosphate buffer (pH 7.0) containing 0.2 M SO4 2- as the internal intensity standard. In addition, rHb(αH87G) and rHb(βH92G) contained 10 mM imidazole. The difference spectra were obtained so that the Raman band of SO4 2- (980 cm-1) could be abolished. The spectra shown are an average of 13 scans.

