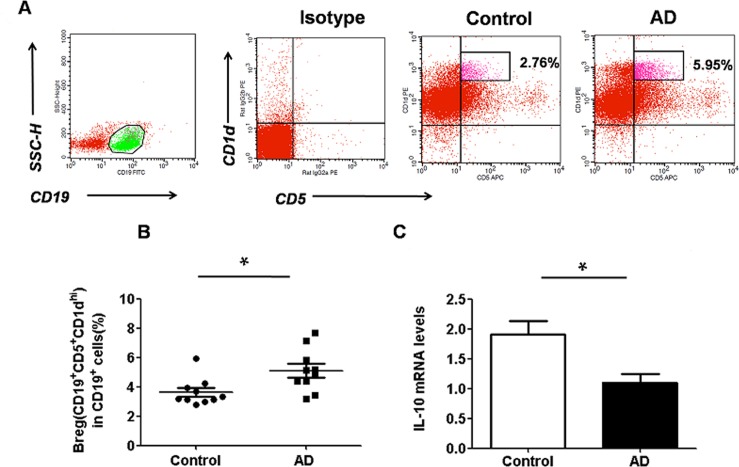
Fig 1. Regulatory B10 cells are augmented and the level of IL-10 expression is decreased in the spleen of AD mice.
(A) Representative dot-plots showing the percentage of CD5+CD19+CD1dhi B10 cells in control (n = 10) and AD mice (n = 10); (B) Bar graph depicting the percentage of CD5+CD19+CD1dhiB10 cells in control and AD mice as analyzed by flow cytometry. The percentage of CD5+CD19+CD1dhi B10 cells was significantly higher in the AD group than that observed in the control. Data are expressed as mean ± SEM.*P<0.05, asanalyzed by one-way ANOVA, followed by Tukey multiple-comparison test; (B) The level ofIL-10 mRNA expression decreased in the spleen of AD mice (n = 10) compared to that of control (n = 10). Data are expressed as mean ± SEM. *P < 0.05, as analyzed by one-way ANOVA, followed by Tukey multiple-comparison test.

