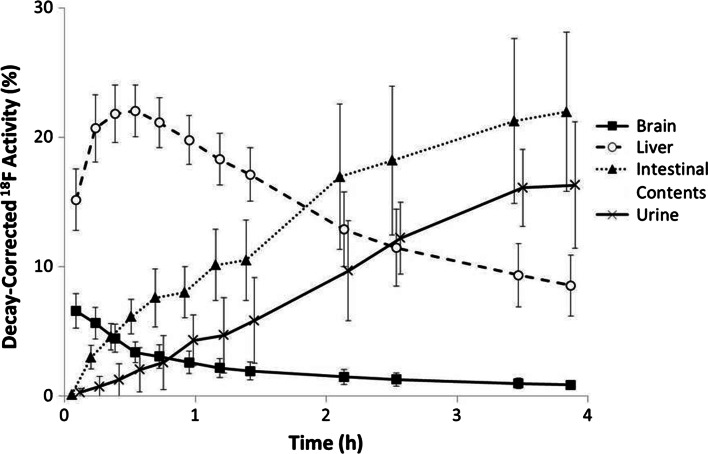
Fig. 2.
Mean decay-corrected 18F activity values in brain, liver, urine and intestinal contents for all six subjects as functions of time following administration of flutemetamol (18F) Injection. Error bars are drawn at ±1 standard deviation and urine and intestinal contents curves have been offset slightly for clarity

