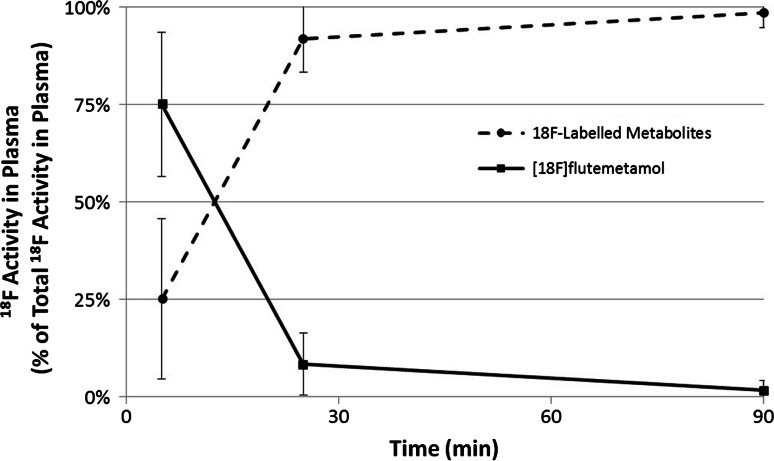
Fig. 5.
Mean areas-under-the-curve for radiochromatograms for [18F]flutemetamol parent and 18F-labelled metabolities in plasma as function of time following administration of flutemetamol (18F) injection. Error bars are ±1 standard deviation. The fraction of the parent compound ([18F]flutemetamol) in the plasma decreased from 75 % at 5 min to 8.3 % at 25 min with the majority of the plasma activity bound to hydrophilic metabolites

