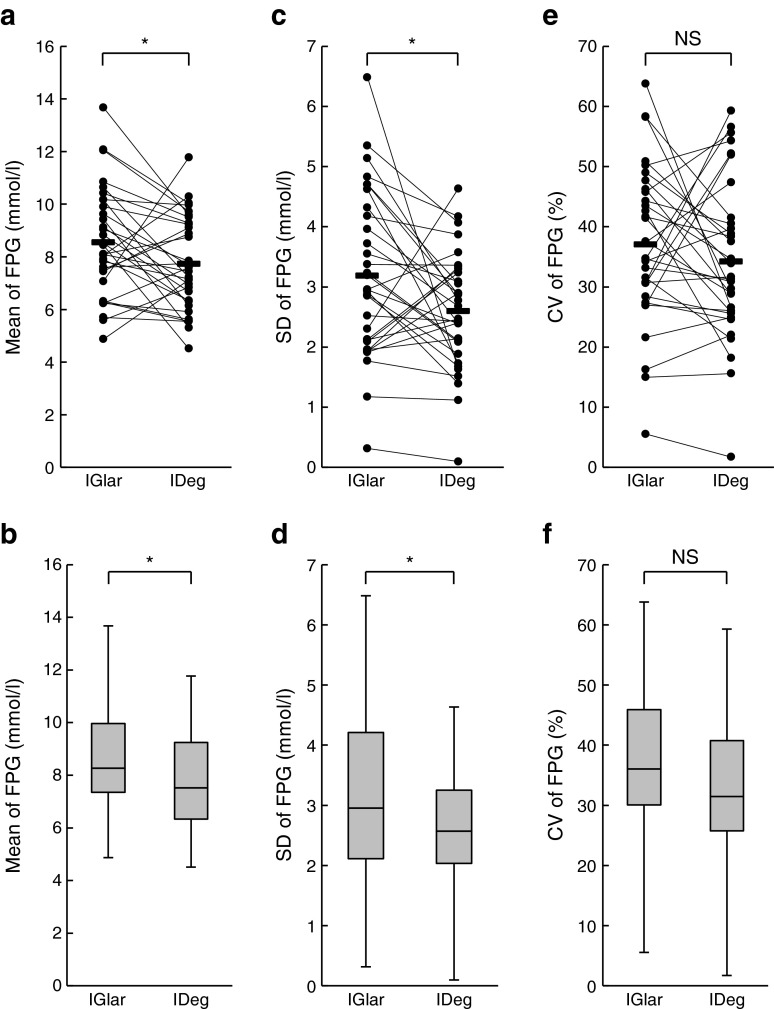
Fig. 2.
Mean and variability of FPG levels. The mean (a), SD (c) and CV (e) of FPG levels during the IGlar and IDeg treatment periods were determined for each participant. The two data points for a particular individual were connected by a line. Horizontal bars represent the corresponding mean values for all participants. Box plots of the mean (b), SD (d) and CV (f) of FPG are shown. The line within each box represents the median, and the top and bottom of the box represent the 75th and 25th percentiles, respectively. The whiskers indicate the maximum and minimum values. *p < 0.05. NS, not significant

