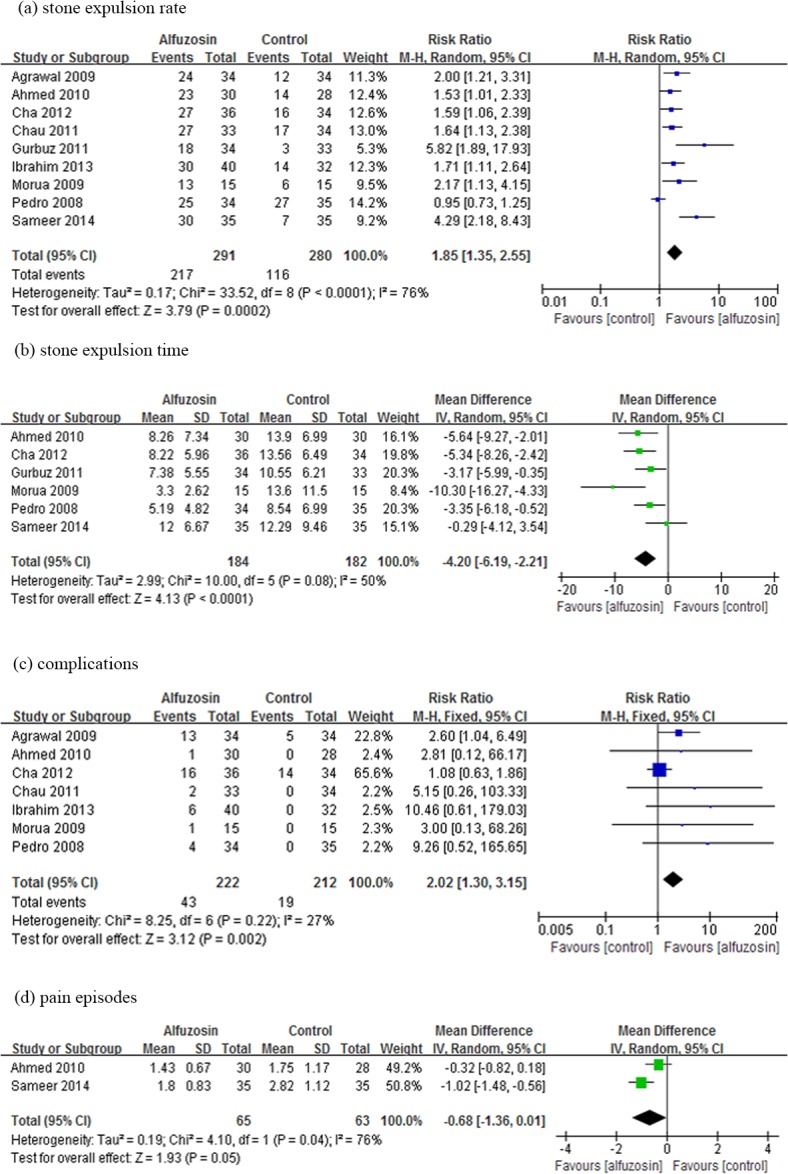
Fig 2. Forest plot of Alfuzosin versus control therapy.

The central square of each horizontal line represents the RR or WMD for each study. The lines demonstrate the range of the 95% CI. The vertical line at an RR of 1 or at WMD of 0 is the line of no effect. % Weight indicates the influence exerted by each study on the pooled RR or WMD. CI = confidence interval; M-H = Mantel-Haenszel; IV = inverse variance; SD = standard deviation.
