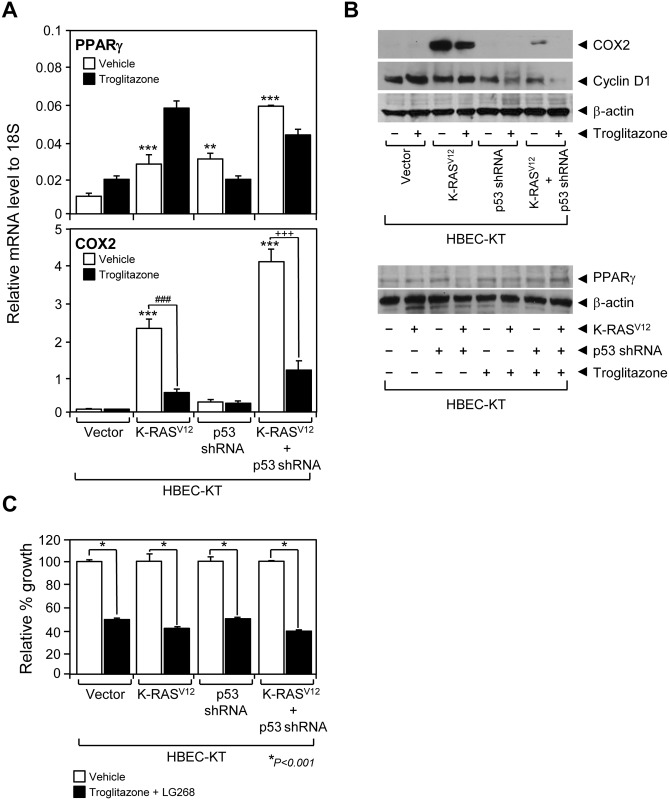
Fig 3. Functional evaluation of PPARγ in immortalized HBECs.
(A) PPARγ and COX2 mRNA expression was measured using QPCR assay in HBEC lines with or without troglitazone treatment. (B) Immunoblots using antibodies against COX2, cyclin D1, PPARγ or beta-actin were used to measure the corresponding protein expression in the HBEC panel when treated or not treated with 1 μM of troglitazone. (C) Growth response of HBEC-KT cell lines to the combined treatment of PPARγ ligand troglitazone (3 μM) and RXR ligand LG268 (100 nM). Data represent the mean ± SD (n = 3). Asterisks show statistically significant points as evaluated by ANOVA. *P < 0.05, **P < 0.01 and ***P < 0.001 compared to HBEC-KT control, ### P < 0.001 compared to K-rasV12 control, +++ P < 0.001 compared to K-rasV12+p53shRNA control.

