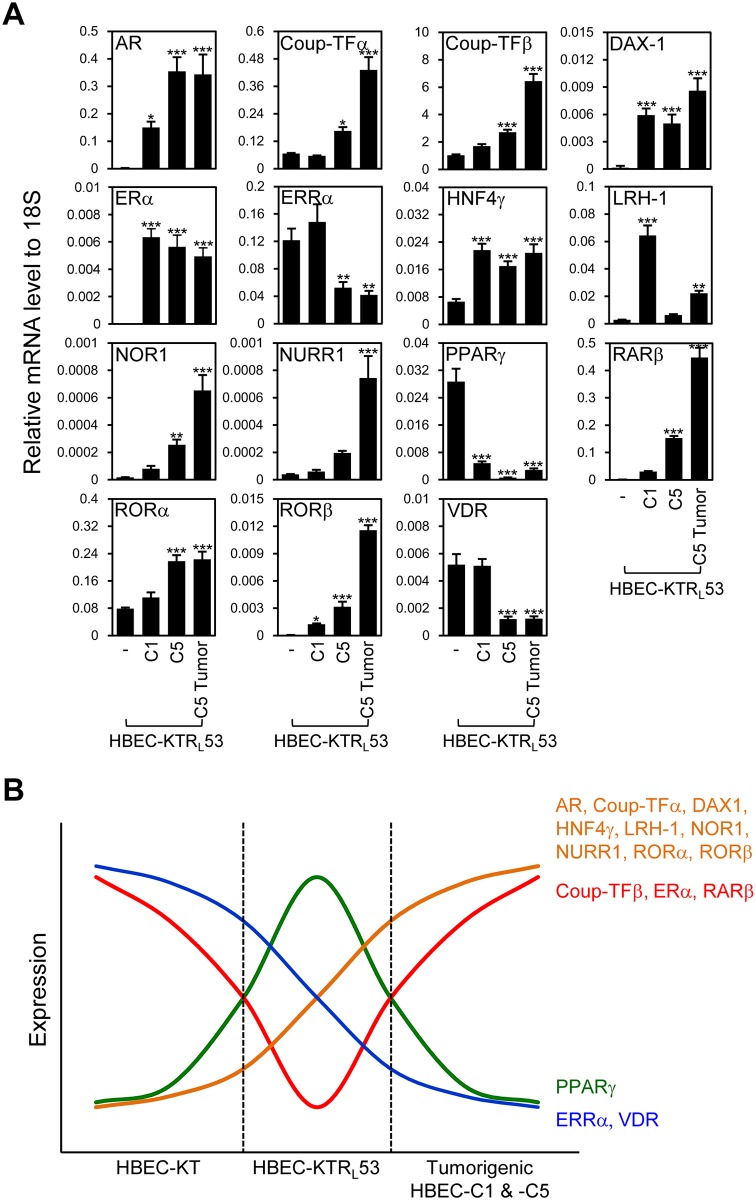
Fig 5. Expression profile of the NR superfamily in tumorigenic HBEC clones.
The QPCR assay was performed for mRNA expression of the entire NR superfamily in non-tumorigenic HBEC-KTRL53 cells with p53 and K-ras V12 changes, two tumorigenic clones C1 and C5, and xenograft C5 tumor tissue. (A) Quantitative mRNA expression profiles of the NR subgroups with distinct expression pattern across the panel. Note that the rest of the NR profile was shown in S4 Fig. (B) Summary of NR expression from panel A and Fig 2 to show NR expression cascades correlated with tumorigenic progression. Data represent the mean ± SD (n = 3). Asterisks show statistically significant points as evaluated by ANOVA. *P < 0.05, **P < 0.01 and ***P < 0.001 compared to HBEC-KTRL53.

