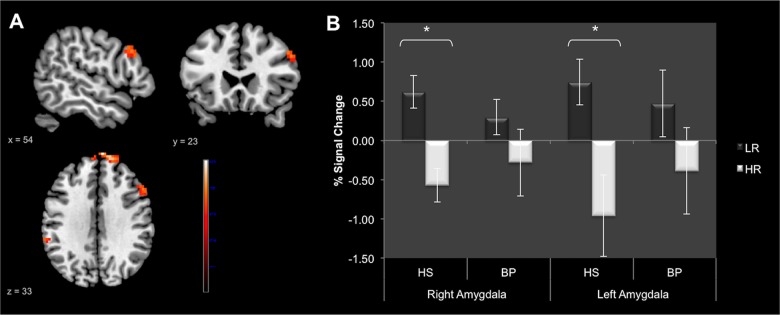
Fig 4. Results provided by between-group analyses.

Panel A: Whole-brain comparison in HS vs BP during conflict monitoring (LR > HR) (p < 0.001 uncorrected at whole brain level, p FWE < 0.05 after small volume correction). Identified regions are projected onto 2D anatomical slices in axial, coronal and sagittal orientations. Panel B: Region of interest analysis focused on bilateral amygdala. The graph shows the mean %MR signal intensity variations ± SE according to the group and the amount of the conflict (LR vs HR). *p<0.05. Abbreviations: BP: Bipolar patients; HS: Healthy subjects; LR: Low conflict resolution; HR: High conflict resolution.
