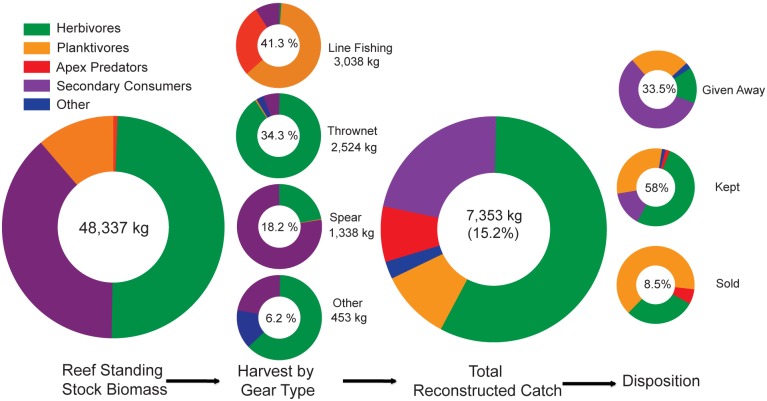
Fig 3. Fish flow from reef to table for Kīholo Bay, with variation in composition of key trophic groups throughout these artisanal supply chains.
The first pie chart shows the total biomass, by tropic group, of reef fish in Kīholo Bay, as determined from in-water ecological surveys. Next, the harvest by gear type is depicted, showing how different gear types target different mixes of trophic groups; the total % of total harvest by each gear type is included in the center of each pie chart. The total expanded catch is approximately 15.2% of the standing stock biomass, and the proportions of the catch vary in comparison to the standing stock trophic composition. Finally, the last three pie charts show which trophic groups are distributed to which end use (disposition); percentages indicate the proportion of the total catch directed toward each end use (given away, kept, sold).

