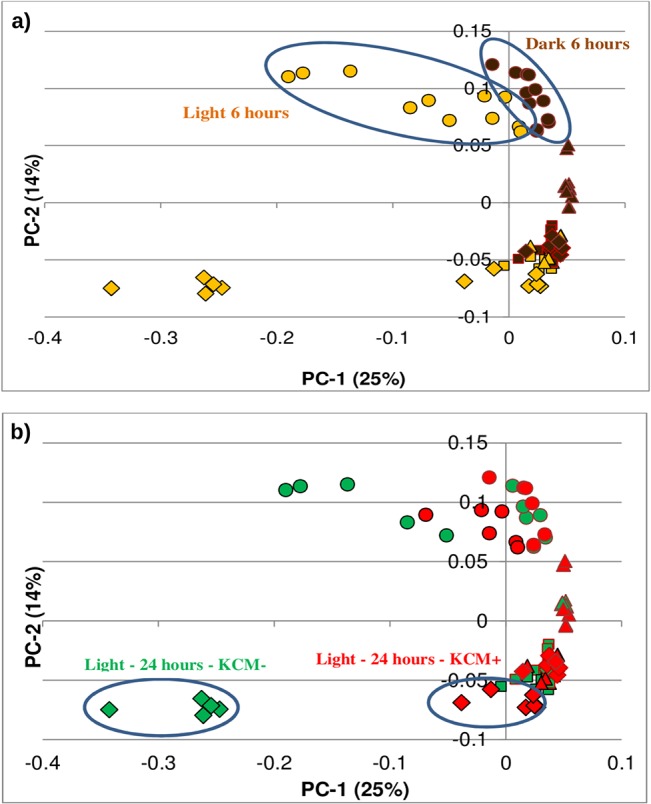
Fig 2. Principal Component Analysis.

Charts a) and b) show the same 2-dimesional representation of the data according to the first 2 principal components, but colored according to different variables. Thus, in a) the effects of time (Squares: Time = 0; Dots: Time = 6 hours; Triangles: Time = 12 hours; Diamonds: Time = 24 hours) and pigmentation (Yellow = Light melanocytes; Brown = Dark melanocytes) are highlighted, while in b), it is the time (Squares: Time = 0; Dots: Time = 6 hours; Triangles: Time = 12 hours; Diamonds: Time = 24 hours) and the type of KCM used which are highlighted (Green: KCM-; Red: KCM+).
