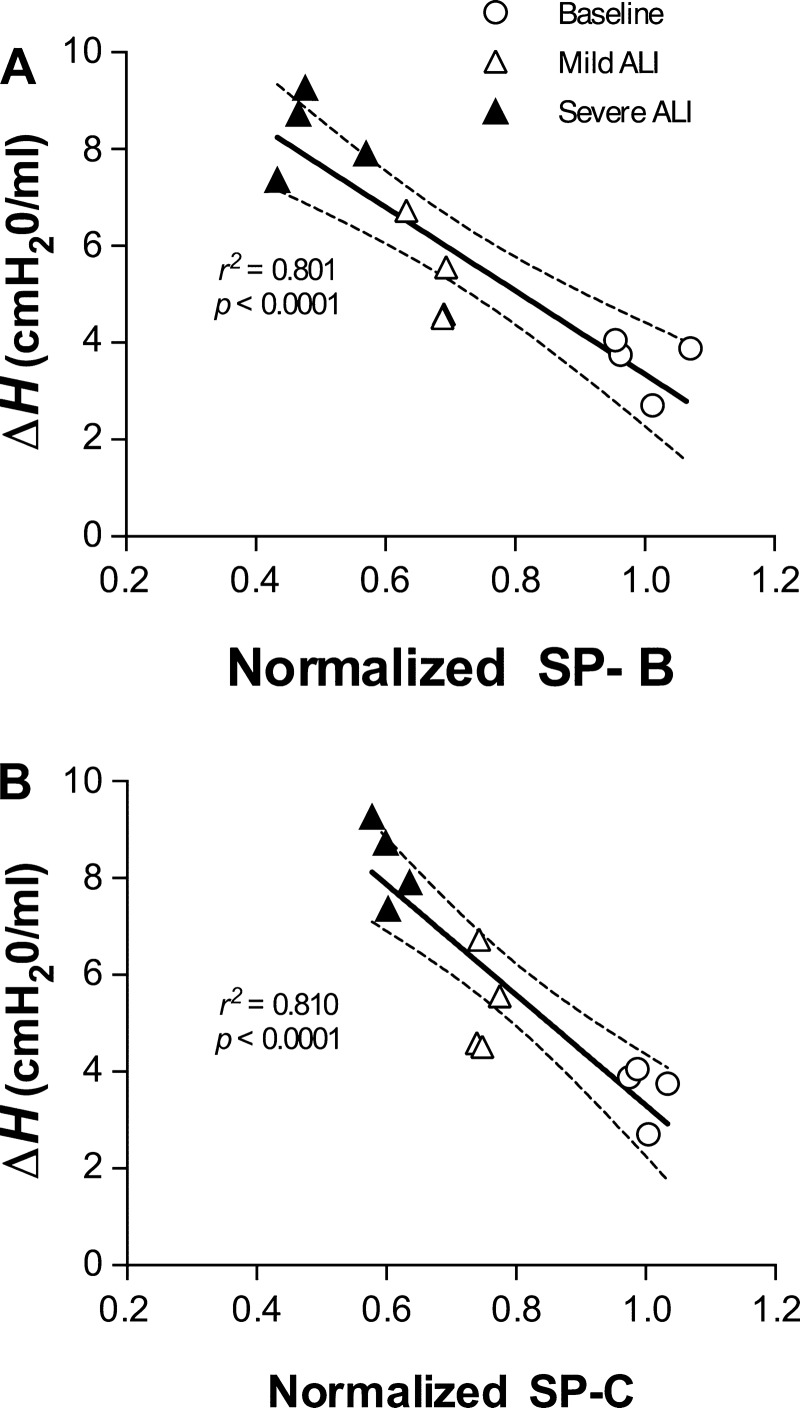
Fig. 5.
Individual values of the changes in H (ΔH) are plotted against the corresponding normalized SP-B (A) and SP-C (B) concentration. Note the strong correlations between ΔH and normalized SP-B (r2 = 0.801, P < 0.0001) and SP-C (r2 = 0.810, P < 0.0001). The black line shows the linear regression, and the dotted lines are the 95% confidence intervals.

