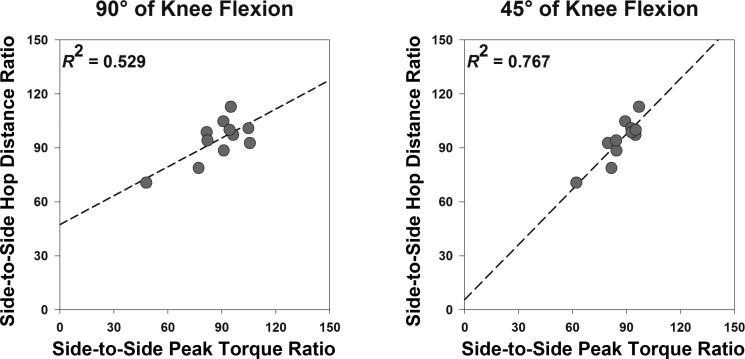
Fig. 4.
Scatterplots demonstrating the relationship between side-to-side peak torque ratio and side-to-side hop distance ratio at 90° (A) and 45° (B) of knee flexion. Dashed lines indicate regression line. Note that the relationship between side-to-side peak torque ratio and side-to-side hop distance ratio was stronger at 45° of knee flexion, which was primarily due to the observation of lower variability between subjects in side-to-side peak torque ratios at 45° (SD = 10%) than at 90° (SD = 16%) of knee flexion.

