
FIG 2 .
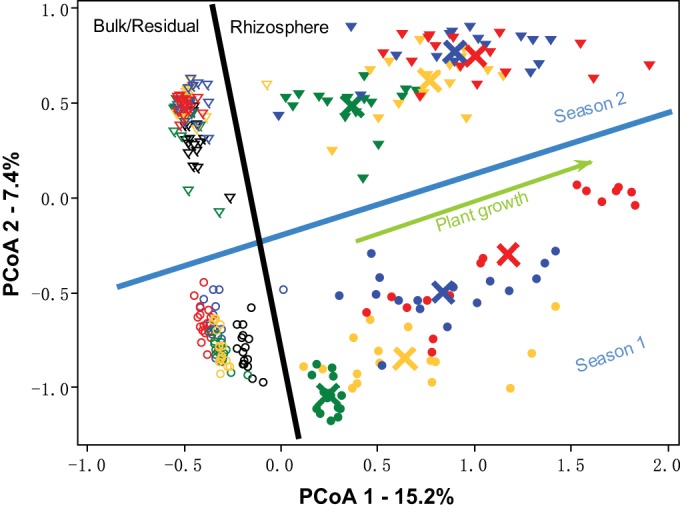
PCoA analysis of bulk/residual soil and rhizosphere microbial community associated with Avena fatua grown in microcosms for 12 weeks in two seasons, based on the Bray distance metric. The percent value for each axis represents the proportion of total variation explained. Circles and triangles represent samples from seasons 1 and 2, respectively. Solid symbols indicate rhizosphere soils, and open symbols indicate the bulk/residual soils. Samples collected at weeks 0, 3, 6, 9, and 12 are shown in black, green, yellow, blue, and red, respectively. Large crosses indicate the centroid of rhizosphere treatment at different plant growth stages in corresponding colors.