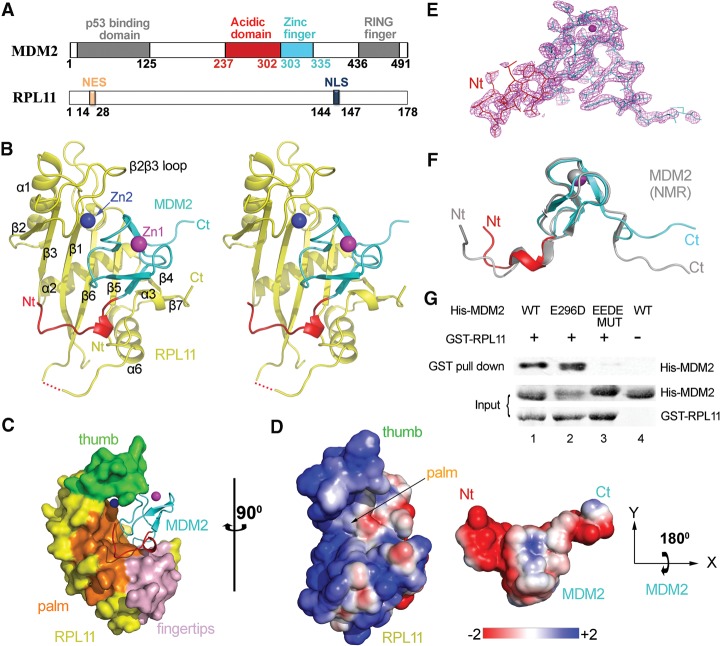
Figure 1.
Crystal structure of the human MDM2–RPL11 complex. (A) Domain organization of MDM2 and RPL11. Numbers indicate residues. (B) Overall structure of the MDM2–RPL11 complex. The domains of MDM2 are shown. (Yellow) RPL11. The two zinc ions are shown as spheres. (C) Surface representation of the MDM2–RPL11 complex. (Orange) β Sheets that formed the palm; (green) the β2β3 loop (thumb); (light pink) the fingertips. (D) The electrostatic potential of the binding interface. The surface potential is displayed as a color gradient ranging from red (negative) to blue (positive). Note that MDM2 is rotated 180° on its X-axis to show the interface. (E) The “omit” electron density map of MDM2, contoured at 1.5 σ. (F) Structural overlay of MDM2 in the MDM2–RPL11 structure and in a NMR structure (gray; Protein Data Bank [PDB] ID: 2C6A) (Yu et al. 2006). (G) The acidic domain of MDM2 is important for RPL11 binding. Purified GST-tagged RPL11 was used for GST pull-down of purified His-MDM2 wild type (WT) and its mutants, EEDE MUT (E292K/E293K/D294K/E296K).

