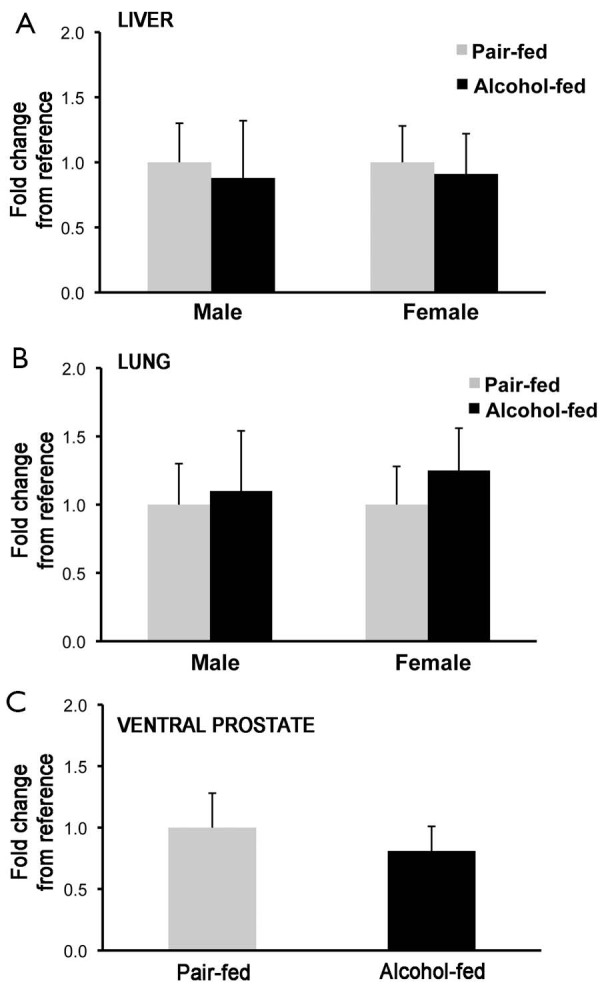
Figure 3.

qPCR analysis of Lrat mRNA levels in various tissues. (A) Analysis performed in liver; and (B) lung of male and female rats; and (C) in ventral prostate. Values are expressed as mean ± SD; n=3-4/group. Statistical analysis as described in the materials and methods.
