Figure 2.
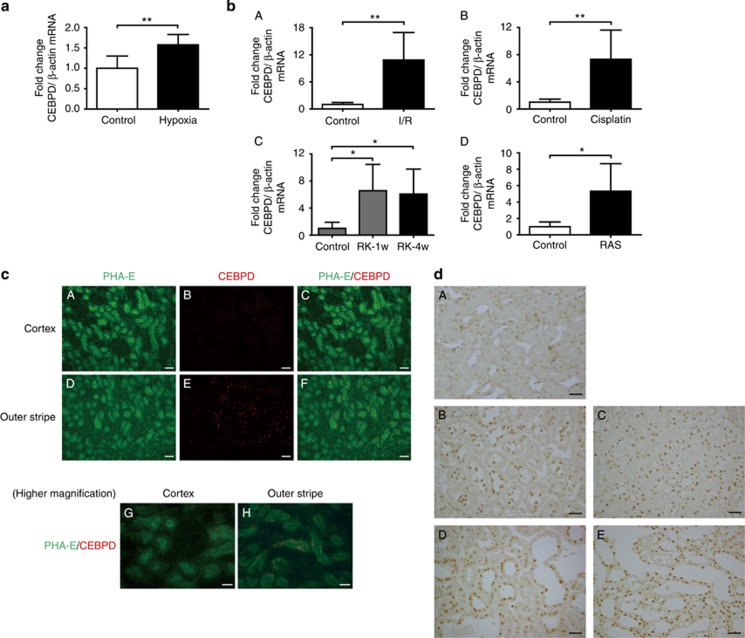
CCAAT/enhancer-binding protein δ (CEBPD) is expressed in hypoxic kidney tubular cells in vivo. (a) Mice were exposed to 8% O2 for 6 h using a hypoxia chamber (hypoxia group, n=6). The mice at ambient oxygen were used as the control (control group, n=5). The whole kidney was examined for CEBPD expression by real-time quantitative (q)RT-PCR. (b) The CEBPD expression levels in the renal cortex of acute and chronic rat hypoxic injuries were evaluated by qRT–PCR. (A) The ischemia–reperfusion (I/R) group (control group, n=6; I/R group, n=6). (B) The cisplatin nephrotoxicity group (control group, n=6; cisplatin group, n=7). (C) The remnant kidney (RK) group (control group, n=5; RK-1w group, n=5; RK-4w group, n=5). (D) The RAS group (control group, n=6; RAS group, n=6). (c) Fluorescent images of control kidney tissues for CEBPD and Phaseolus vulgaris Erythroagglutinin (PHA-E), a marker for proximal tubules. (A–C) Cortex and (D–F) outer stripe (OS) of the outer medulla, × 200. Bar=50 μm. CEBPD is stained in the S3 segment of proximal tubules in the OS. (G) Cortex and (H) OS of the outer medulla for further higher magnification, × 400. Bar=30 μm. (d) (A) Control kidney and four hypoxic kidney models ((B) I/R group, (C) cisplatin group, (D) RK group, and (E) RAS group) were stained with an anti-CEBPD antibody. CEBPD is stained in the nuclei of tubular cells in all four models compared with the control kidney. Original magnifications, × 400. Bar=30 μm. Bar graph (combined results from two independent experiments, shown as mean±s.d.) statistics performed using Student's t-test or one-way analysis of variance (ANOVA) with Dunnett's post-hoc tests. *P<0.05 and **P<0.01.

