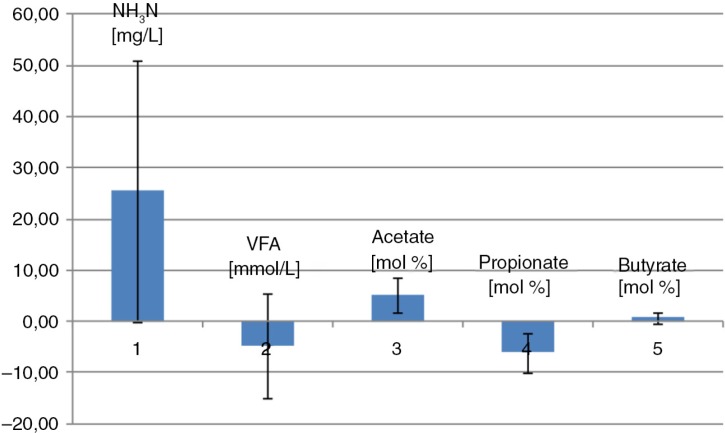
Fig. 1.
Caecal VFA and NH3-N. Mean difference between the two diets. The barplot is illustrating the mean difference between the two diets in NH3N, VFA, acetate, propionate, and butyrate. Mean difference values above the zero line imply a higher mean value in the hay-fed horses than in whole oats–fed horses, whereas mean difference values under the zero line imply a lower mean value in the hay-fed horses than in whole oats–fed horses. Error bars represent standard deviations.

