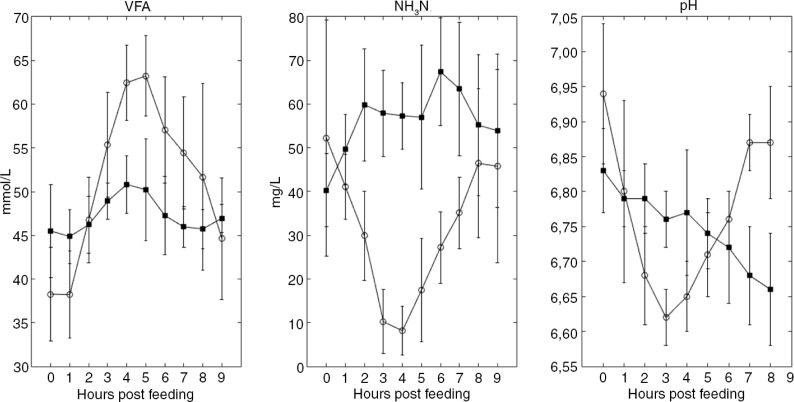
Fig. 2.
Caecal VFA and NH3-N. Temporal differences. Head titles indicate VFA, NH3N, and pH values. Caecal measurements related to the oat diet are marked with ◯, and caecal measurements related to a hay diet are marked with ■. Each time point represents mean values. Error bars represent standard deviations.

