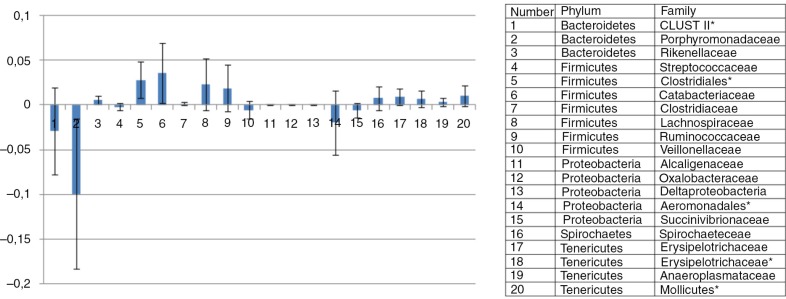
Fig. 3.
OTU's. Mean difference between the two diets. Bar plot illustrating the mean difference between the two diets in abundances of bacterial representatives of the phyla: Bacteroidetes, Firmicutes, Proteobacter, Spirochaetes, and Tenericutes. Bacterial representatives with mean difference values above the zero line imply that they showed a higher mean abundance in the hay-fed horses than in whole oats–fed horses, whereas bacterial representatives with mean difference values under the zero line imply that they had a higher mean abundance in the whole oats–fed horses. Bacterial representatives marked with a star (*) means that the OTUs were not identified down to the family level. Error bars represent standard deviations.

