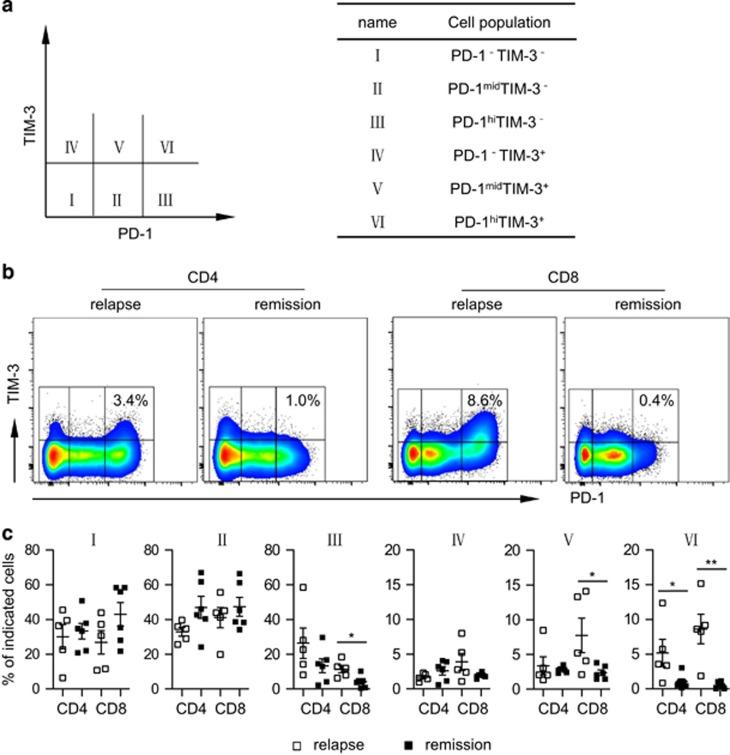
Figure 2.
PD-1hiTIM3+ cells associate with leukemia relapse post alloSCT. PBMCs from patients with leukemia relapse vs remission were tested for PD-1 and TIM3 expression on CD4+ and CD8+ T cells by flow cytometry. (a) Based on levels of PD-1 and TIM3 expression, cells are divided into six fractions. Shown is the schema of each fraction. (b) Representative flow data from one relapse (patient 09) and one remission (patient 02). Percentage of PD-1hiTIM-3+ among CD4+ or CD8+ cells is shown. (c) Plot of percentage of each fraction among CD4+ or CD8+ cells in patient with relapse (n=5) vs remission (n=6). Each square represents data of an individual patient. *P<0.05, **P<0.01.

