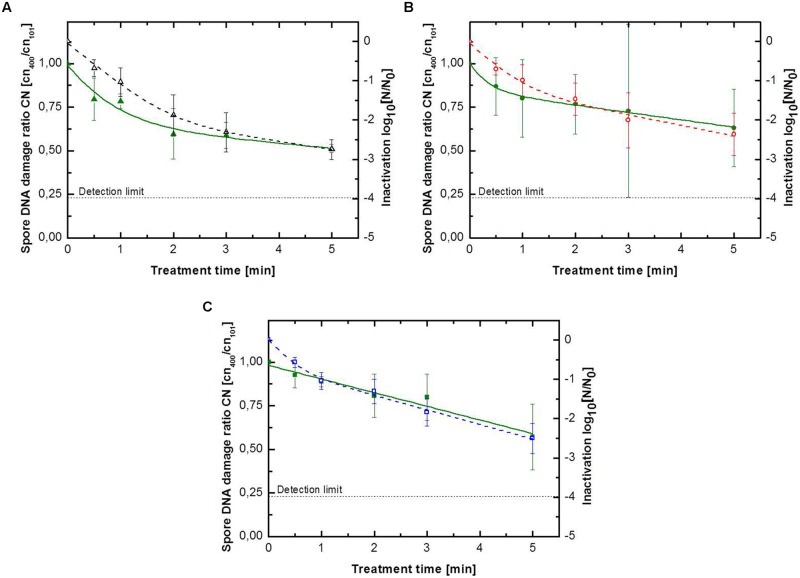
FIGURE 3.
Kinetics for B. subtilis endospores inoculated on glass petri-dishes for (A) pure argon with (△) inactivation and ( )endospore DNA damage ratio, (B) argon + 0.135% vol. oxygen with (
 ) inactivation and (
 )endospore DNA damage ratio, (C) argon + 0.135% vol. oxygen + 0.2% vol. nitrogen with (
 ) inactivation and (
 ) endospore DNA damage ratio. Solid lines represent the biphasic fit for the DNA damage and the dashed lines for endospore inactivation.

