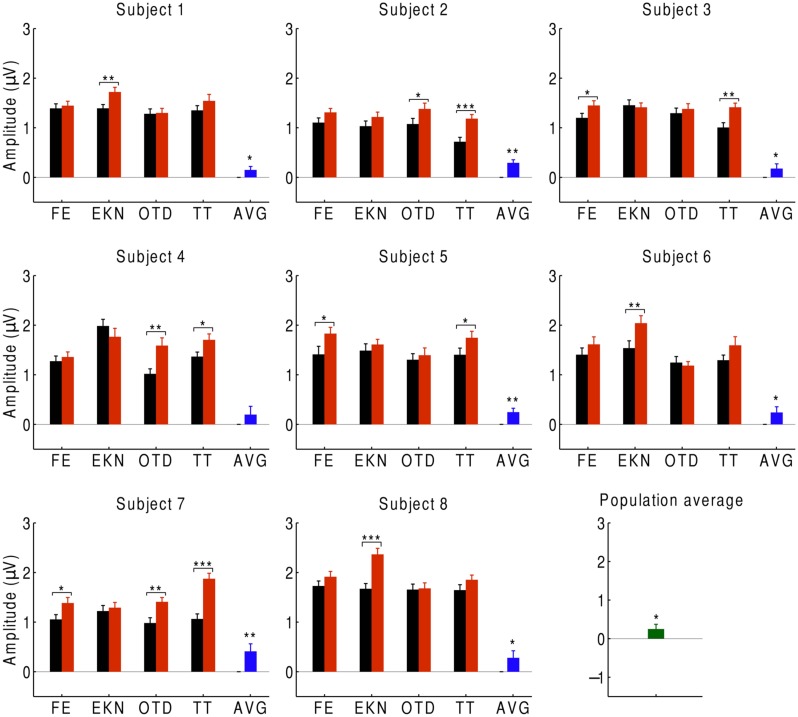
FIGURE 2.
Cortical responses to musical pieces and their scrambled versions. For eight subjects, we show the EEG responses at the beat frequency during listening to musical pieces (black) and to their scrambled versions (red). The EEG responses are the averages over the signals of the beat-responsive channels. Each subject experienced four trials with distinct musical pieces, abbreviated as FE, EKN, OTD, and TT. Error bars denote the SEM. The differences in the response were statistically significant in about half of the trials (*p < 0.05; **p < 0.01; ***p < 0.001). The average differences in the EEG responses at the level of individual subjects were significant in all but one subject (blue). The population average—that is, the differences in EEG responses averaged over all subjects—was significantly positive as well (green).

