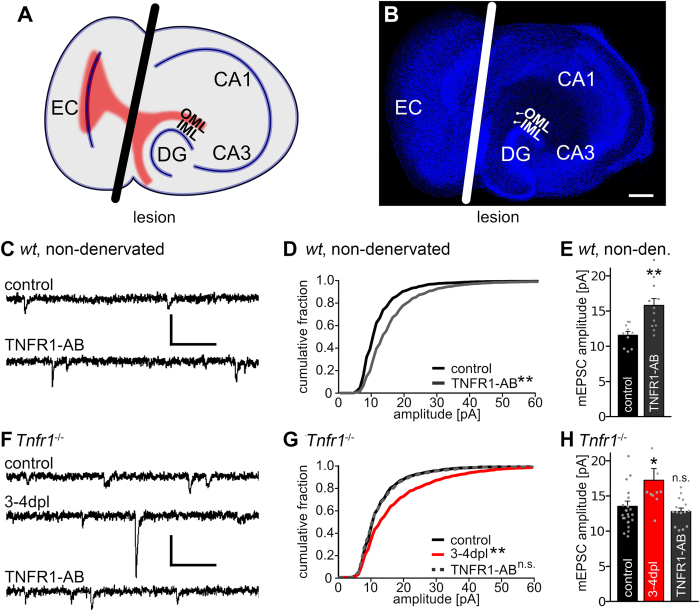
Figure 1. Activation of TNFα receptors leads to an increase in synaptic strength.
(A) Schematic of an entorhino-hippocampal slice culture. Fibers from the entorhinal cortex are shown in red. The black line indicates the lesion (EC, entorhinal cortex; CA1, CA3, cornu ammonis 1, 3; DG, dentate gyrus; IML, OML, inner and outer molecular layer, respectively). (B) Example of an entorhino-hippocampal slice culture (blue: TO-PRO® nuclear staining; white line: lesion site, scale bar: 200 μm). (C,F) Sample traces of whole-cell voltage-clamp recordings from dentate granule cells in non-denervated wild type slice cultures and in cultures prepared from TNFR1-deficient animals (Tnfr1−/−; dpl, days post lesion; scale bars: vertical, 20 pA; horizontal, 100 ms). (D,E,G,H) Cumulative distribution and mean values of mEPSC amplitudes. Treatment with TNFR1-AB (2 μg/ml) for 3 days increased mEPSC amplitudes significantly in wild type but not Tnfr1−/− preparations. [wild type: controls: n = 10 cells; TNFR1-AB: n = 12 cells, from 4–6 cultures; Tnfr1−/−: controls: n = 16 cells; 3–4 dpl: n = 10 cells; TNFR1-AB: n = 15 cells, from 5–9 cultures; in D and G: Kolmogorov-Smirnov test; in E and H: Kruskal-Wallis-test followed by Dunn’s post hoc test; *indicates p < 0.05, **p < 0.01, n.s., not significant; in H one data point in the denervated group (3–4 dpl) is not shown: 30.1 pA].

