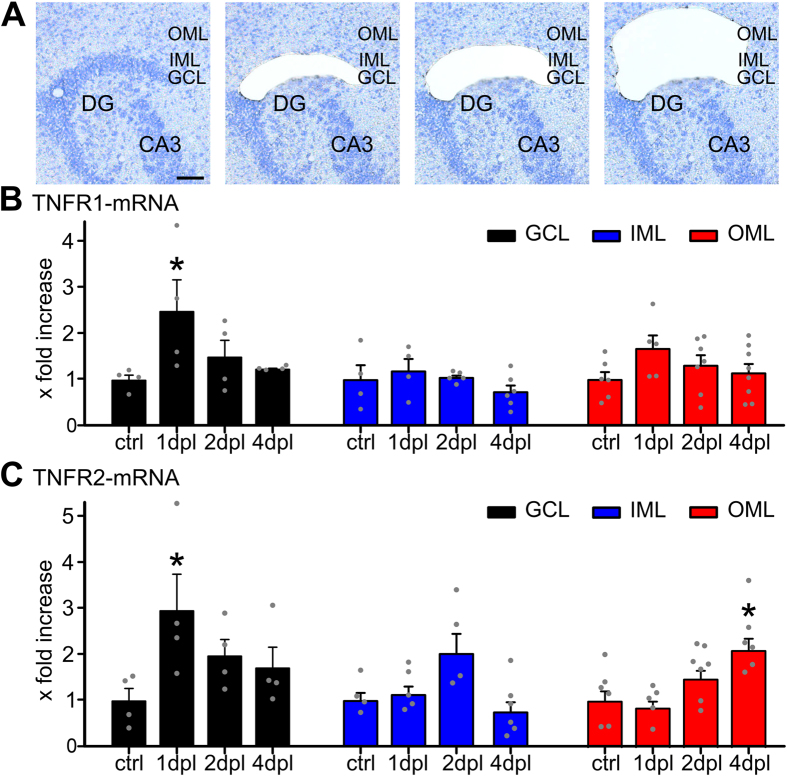
Figure 4. Laser capture microdissection combined with qPCR reveals changes in TNFR1- and TNFR2-mRNA levels following entorhinal denervation in vitro.
(A) Laser capture microdissection (LMD) was employed to collect tissue from the granule cell layer (GCL), the inner molecular layer (IML), and the outer molecular layer (OML) of denervated cultures (at 1, 2, and 4 dpl) and non-denervated control cultures (scale bar: 50 μm). (B) TNFR1-mRNA levels were assessed in the isolated tissue using qPCR. An increase in TNFR1-mRNA was observed in the GCL at 1 dpl (n = 4–8 probes per group; Kruskal-Wallis-test followed by Dunn’s post hoc; *indicates p < 0.05; n.s., not significant). (C) TNFR2-mRNA levels were assessed in the isolated tissue using qPCR. An increase in TNFR2-mRNA was observed in the GCL at 1 dpl and in the OML at 4 dpl (n = 4–8 probes per group; Kruskal-Wallis-test followed by Dunn’s post hoc test; *indicates p < 0.05; n.s., not significant).

