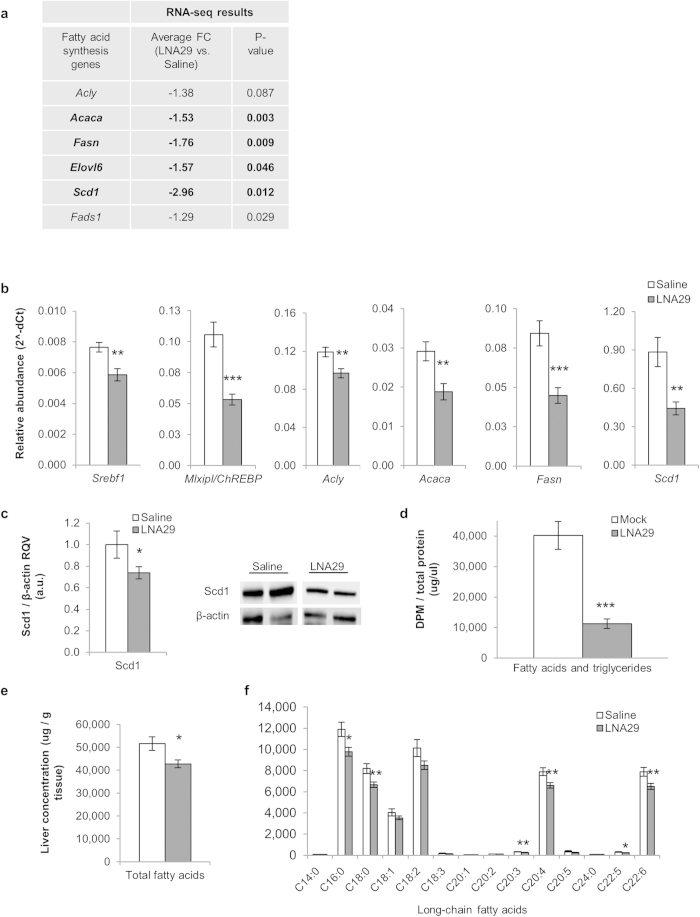
Figure 4. Inhibition of miR-29 represses the fatty acid synthesis pathway and reduces fatty acid content in the liver.
(a) Expression fold-change (FC) by RNA-seq in LNA29-treated mice (n = 6) relative to saline-treated controls (n = 6) is shown for key genes in the hepatic fatty acid synthesis pathway. p-values were calculated by one-tailed unpaired Student’s t-test. (b) RT-qPCR validation of RNA-seq results shown for Srebf1, Mlxipl/ChREBP, Acly, Acaca, Fasn and Scd1. Relative abundance (2^-dCt) was compared between LNA29-treated (n = 14) and saline-treated (n = 12) mice. Rsp9 was used as the normalizer. (c) Densitometry analysis shown for Scd1 protein in livers from LNA29-treated mice (n = 10) compared to saline-treated controls (n = 8). β-actin was used as the loading control. Immunoblot results also shown for two representative mice from each treatment group. (d) Quantification of radiolabeled acetate incorporation into fatty acids in vitro (Huh7 cells) after transfection with LNA29a (10 nM, n = 6) or transfection reagent alone (Mock, n = 6). (e) Measurement of total fatty acid levels in the livers of LNA29-treated animals (n = 14) compared to saline-treated controls (n = 12). (f) Levels of individual long-chain fatty acids in LNA29-treated relative to saline-treated mice. C14:0 (Myristic acid), C16:0 (Palmitic acid), C18:0 (Stearic acid), C18:1 (Oleic acid), C18:2 (Linoleic acid), C18:3 (Linolenic acid), C20:1 (Gondoic acid), C20:2 (Eicosadienoic acid), C20:3 (Homogamalinolenic acid), C20:4 (Arachidonic acid), C20:5 (Eicosapentaenoic acid), C24:0 (Lignoceric acid), C22:5 (Docosapentaenoic acid), C22:6 (Docosahexaenoic acid). *p < 0.05; **p < 0.01; ***p < 0.005; p-values were calculated by two-tailed unpaired Student’s t-test. Error bars represent standard error of the mean.

