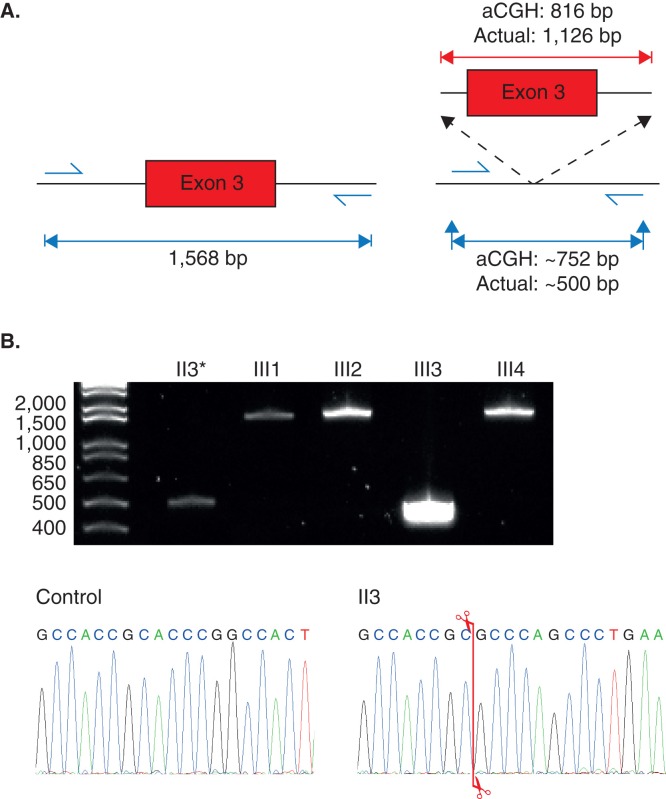
Figure 4.
PCR amplification of the region encompassing exon 3 of the RYR2 gene. A: Amplicon sizes of the expected PCR products using DNA from an unaffected individual carrying no deletion of exon 3 of the RYR2 gene (left), and for DNA with the exon 3 deletion (right). The deletion size according to aCGH and the actual deletion size confirmed by Sanger-based sequencing are shown (above red lines). The expected PCR amplicon size of the deletion mutant according to the aCGH data and the actual product size are both shown. B: 2% agarose gel showing the results of PCR amplification of the genomic region encompassing exon 3 of the RYR2 gene for the proband (II-3) and her four children (III-1 to III-4). Chromatogram of the control and the proband showing where the breakpoint is (indicated by the red line).

