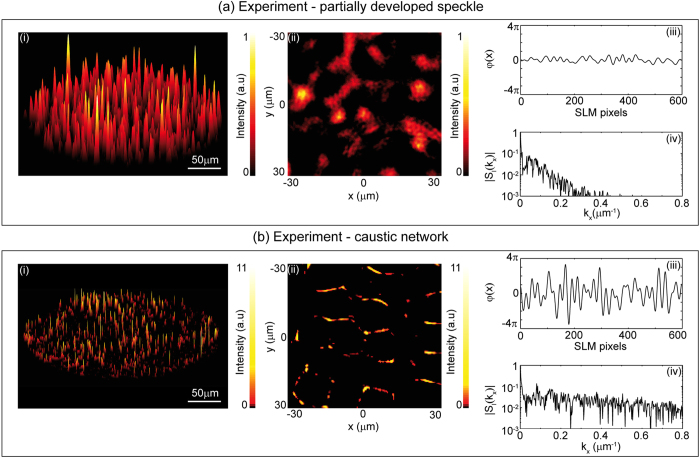
Figure 3.
Experimental results showing (a) partially-developed speckle and (b) a caustic network. For each case, (i) shows the computed intensity distribution; (ii) shows a zoom over a more limited region looking down on the pattern; (iii) shows a slice of the applied phase distribution to the SLM at y = 0; (iv) shows the calculated spatial spectrum corresponding to the intensity distribution in (i). Intensities in (b) are normalised relative to the maximum intensity for the partially-developed speckle in Fig. 3a. Note the different intensity scales used between (a,b).

